 ISTOCKPHOTO, COSMIN4000
Exploring the field of cancer genomics can give a researcher without a sturdy footing in bioinformatics a bad case of information overload. But the potential payoff is high. Cancer researchers have been amassing data on small mutations, copy number variations, epigenetic changes, expression level differences, and clinical features for a number of cancer types since long before the first whole cancer genome sequence (of an acute myeloid leukemia) was completed in 2008. That means researchers diving into the fray today will have more—and higher quality—information at their fingertips than ever before. Yet navigating it won’t be easy, says William Hahn, an associate professor of medicine who studies a number of cancers at the Dana-Farber Cancer Institute in Boston. “It’s a huge challenge to know what’s out there and how to use it.”
Much of the available genomic data comes from a handful of large international collaborations. The...
Once you’ve got the data, the trick is to know what they can and cannot tell you, says Hahn. But whatever type of data you search for, he cautions, your in silico analyses should be considered hypothesis-generating. At the end of the day, you have to go back to the lab or into the clinic to validate them.
The Scientist surveyed freely available data, visualization, and analysis portals for cancer genome information to bring you a start-up guide for integrating the approach into your work.
Is my favorite gene mutated in cancer?

A good starting point is to check for known mutations and other aberrations in your gene of interest. The ICGC Data Portal offers several search routes. Enter a gene name, NCBI accession number, or Ensembl gene ID in the Gene Search field, click through to the Gene Report, and under Mutation Summary you’ll find the mutations and copy number changes detected and their frequency in the tumors analyzed to date. The COSMICsection just below lists somatic mutations, including point mutations, small deletions, and insertions, from the COSMIC database.
Another tack is to look for all the affected genes in a tumor type. In the ICGC Data Portal, you can accomplish this by clicking Genes under Database Search, and from there, selecting the type of cancer you’re interested in as well as optional sub-parameters such as the pathway you’d like to explore. Alternatively, in the TCGA’s Data Portal, you can select Bulk Download from the Download Data menu and retrieve information on somatic mutations, or other data types such as copy number, DNA methylation, and gene expression, for a number of tumor types.
Both ICGC and TCGA data are publicly available, but note that they have already been processed: sequences have been confirmed by various techniques, and patient-identifying information, such as the presence of germline SNPs, has been removed. “By and large, the processed data is our best attempt to provide information that is accurate and has few false positives,” says Lincoln Stein, director of informatics and biocomputing at the Ontario Institute for Cancer Research in Toronto. Researchers can request access to raw data through ICGC’s Data Access Compliance Office if they would like to know the germline SNPs, which could be relevant in studies of cancer risk and cancer drug response.
Also, consider supplementing your ICGC search with an exploration of data sets from other centers, including TCGA’s Data Portal. ICGC only updates the database every few months, whereas TCGA updates as new data become available. What’s more, ICGC does not store TCGA’s raw data—to access it, submit a Data Access Request form to TCGA.
Are the mutations in my favorite gene “drivers” in this tumor type?
Finding a gene mutation in tumor samples is just the beginning. The next step is differentiating the drivers that actually contribute to the cancer phenotype from the passenger mutations that many cancers pick up pell-mell because of their genomic instability.
The frequency of the mutation can provide some clues. “If it’s mutated in 5 or 8 or 10 percent [or more] of cancers, then you say it’s probably important,” Hahn says. It’s harder to judge for less frequently mutated genes, which can still be important to the biology and progression of tumors, he explains, adding that data from rare mutations may not be reliable if your gene has only been sequenced in a few samples. ICGC’s Mutation Summary is one source of mutation frequency data. Another option is the Memorial Sloan-Kettering Cancer Center’s (MSKCC) cBio Cancer Genomics Portal, a user-friendly site for working with data from TCGA and other data sets. You can query this portal by entering the name of one or more genes. The output is a list of cancer studies of different tumor types; click on a study, and then on View Cancer Study Details, to call up a graphic—referred to as an “oncoprint”—that represents the frequency of genomic alterations.
You can also predict the functional impact (high, medium, low, or neutral) of missense mutations using a tool within MSKCC’s portal called MutationAssessor. Like other methods, MutationAssessor looks at conservation across all the homologs of a protein, but, unlike others, it also takes into account the conservation within just the closest homologs, which is called “specificity.” This gives the tool an advantage in predicting mutations that have a functional impact, particularly those that lead to a change in function rather than a loss or gain of function, says Boris Reva, who developed the tool with colleagues at MSKCC.
If you are in View Cancer Study Details in the MSKCC portal, clicking the Mutations tab takes you to a table with a column labeled Predicted Impact. Clicking on items in this column opens an output table summarizing information about the gene mutation you’re looking at. To see how well conserved the mutated amino acid residue is, click on MSA (multiple sequence alignment) for a sequence alignment with the conservation and specificity score above each amino acid. Alternatively, because MutationAsssessor is also a stand-alone tool, you can enter your mutation of interest in the text box on its site to obtain a similar output table.
What are the genes and pathways that are associated with a tumor type?

Many cancer researchers are looking beyond individual genes to map gene networks. One way to do this is with Regulome Explorer, a set of tools developed by the Institute for Systems Biology in Seattle, Washington, and MD Anderson Cancer Center at the University of Texas in Houston that provides a wide-ranging view of connections between mutations, expression level changes, and clinical outcomes. The tool is currently loaded with three TCGA data sets, with plans to add more in the next 6 months. To explore networks in which a gene might be involved, select the first tool on the portal page, All Pairs Significance Tests, which looks for pairwise associations. The new window that opens shows a graphical representation of a breast cancer data set, but you can load one of the others by going to the Data menu and clicking Select. In the dialog box on the right, enter your gene of interest in the Label field under Feature 1. Under Feature 2, choose the type of genomic change and the gene for which you want to find associations, then click Filter. Or, you can leave both boxes in Feature 2blank, and view all the genomic associations; mousing over a line tells you the change associated with your gene of interest.
You can do the same analysis of data with a different list of cancer types in MSKCC’s cBio Portal. Just enter your gene—say, Trim2—in the gray field, as before, and click Submit. After you select the tumor type and click View Cancer Study Details, you can review the network of known gene interactions and pathways involving the gene under the Network tab. You can mouse over a gene, represented as a node, to see a color-coded wheel summarizing its mutation, expression, and copy number status. (The color for each alteration is under the Legend tab.)
Of course, many gene networks are unknown. A tool called Dendrix predicts whether genes share a pathway by using an algorithm that searches for genes mutated in a mutually exclusive pattern. To run Dendrix, upload two text files to a server at ccmbweb.ccv.brown.edu/dendrix—one listing all the genes mutated in samples of a particular tumor type (for example, a TCGA data set), and the other listing just the genes you want to analyze. Leave out genes mutated at very high frequency, which skew the results, says Fabio Vandin, a bioinformatician who developed Dendrix with colleagues at Brown University. The completed analysis will be e-mailed to you, usually within a day, as a text file readable via a platform called Cytoscape.
What are the clinical associations with genomic changes?
“When you submit to journals these days, there’s quite a good chance the referees will say, ‘What does this gene mutation do in the clinic to patients?’” says Markus Bredel of the University of Alabama at Birmingham, who studies gene mutations that correlate with short survival times for patients with glioblastoma.
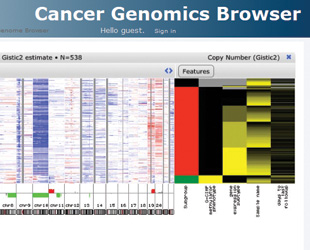
Several university-operated visualization tools can address this question. Oncoprints at MSKCC cBio Portal show survival curves associated with genomic alterations in the Survival tab. Alternatively, the University of California Santa Cruz Cancer Genomics Browser lets you probe associations between an array of clinical parameters and genomic data for many data sets. Click on Cancer Genomics Browser at the top of the menu on the left to be directed to the list of data sets. After choosing a data set, click on the Heatmap box in the tab that appears on the right to view genomic and clinical heat maps. You can explore associations between a clinical feature and genomic changes by clicking the Features button above the clinical heat map. This opens a window in which you can create two patient groups based on various differences, say, in age at diagnosis. Select Student’s T-test from the Statistic drop-down menu and hit Generate Statistics to view all the statistically significant genomic differences between the groups: red bars and green bars indicate that genomic variation is more likely in group 1 or group 2, respectively. You can zoom in to get genomic data from individual samples, which are arranged vertically above the corresponding chromosomal position, says Jing Zhu, who manages the UCSC Cancer Genomics Browser. She encourages researchers who want more information about these clinical parameters to contact her team at genome-cancer@soe.ucsc.edu.
Interested in reading more?


